Certificate Compliance Report

The Certificate Compliance Report is now available under Certificate Monitoring > Compliance. It generates a PDF designed to go directly to an auditor or into a compliance package, not something you screenshot and annotate yourself.
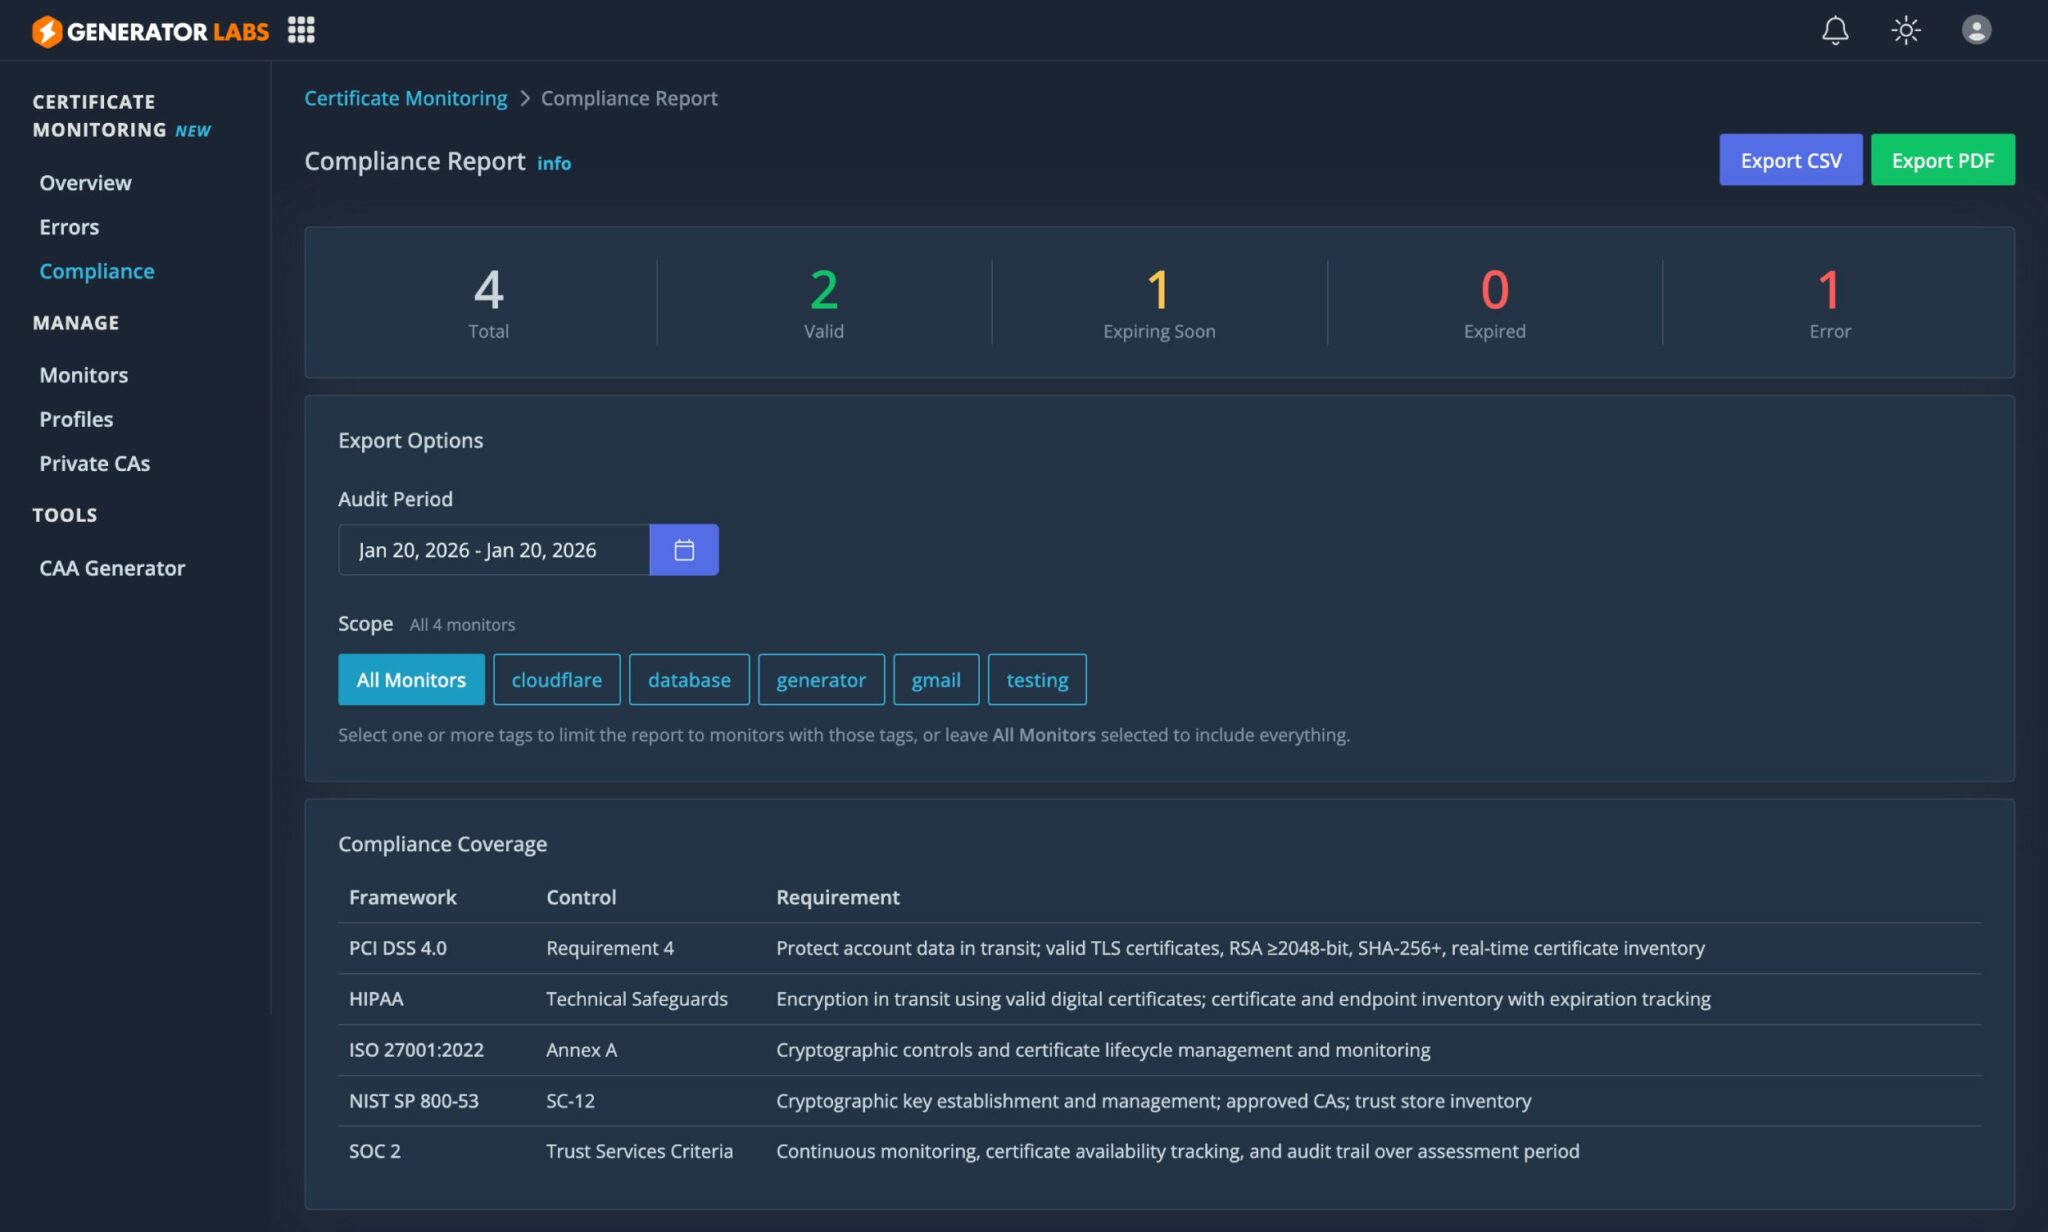
Certificate Compliance Report

A Report Auditors Can Actually Use

The report is self-contained. It opens with a methodology section that describes exactly what each check does and why: chain verification, OCSP revocation, cryptographic strength at every level, hostname validation, fingerprint tracking. An auditor reading it can evaluate the monitoring approach without having to ask you follow-up questions. A field definitions table does the same for the data: every column in the certificate inventory is defined so the report interprets itself.

The compliance coverage section maps the report to specific controls across five frameworks:

Framework Control Requirement
PCI DSS 4.0 Requirement 4 Valid TLS certificates, RSA >=2048-bit, SHA-256+, real-time certificate inventory
HIPAA Technical Safeguards Valid digital certificates; certificate and endpoint inventory with expiration tracking
ISO 27001:2022 Annex A Cryptographic controls and certificate lifecycle management and monitoring
NIST SP 800-53 SC-12 / SC-17 Cryptographic key establishment; approved CAs; unique certificate identification by serial
SOC 2 Trust Services Criteria Continuous monitoring, certificate availability tracking, audit trail over assessment period

What's in the Certificate Inventory

Each host gets full certificate detail: issuer, serial, key type and size, algorithm, SANs, validation type (DV/OV/EV derived from policy OIDs), revocation status, and chain trust result. The inventory is organized by status: errors first with specific diagnostic reasons (DNS failure, hostname mismatch, handshake failure, etc.), then expiring, then valid.

Wildcard certificates are flagged explicitly. PCI DSS 4.0 restricts wildcard use in cardholder data environments, so knowing how many you have and where they are matters.

The executive summary gives auditors a quick read: status counts, expiry outlook bucketed at 30/60/90 days, and audit period activity: total checks run, how many monitors had errors, how many were resolved, and how many are still open.

Evidence That Holds Up

Compliance programs don't just want a point-in-time snapshot. They want proof that monitoring was running continuously and that problems were caught and resolved. Every check result is stored as an immutable timestamped event record. When an auditor asks whether a certificate was valid on a specific date, the answer comes from those records.

If a monitor wasn't active for the full audit window, the report says so: the actual coverage dates and day count appear alongside the selected period. Partial coverage is disclosed, not quietly omitted.

Includes Internal Infrastructure

Hosts monitored via the internal agent appear alongside public-facing hosts. Internal services on private IPs, database connections, LDAP, and certificates issued by a private CA are all included. The report covers your full certificate inventory, not just what is reachable from the internet.

Go to Certificate Monitoring > Compliance, set the audit period, and download. Each report gets a unique reference number that appears on every page, suitable for tracking in your compliance documentation.

Learn more about Certificate Monitoring.

MCP Server for AI Monitoring

Generator Labs now runs a hosted MCP (Model Context Protocol) server so that any MCP-aware AI tool can access your monitoring data. The server exposes tools across RBL monitoring, certificate monitoring, notifications, and account management.

What You Can Do

Once connected, you can ask your AI tool questions like:

  • "Which of my hosts are currently listed on any RBL?"
  • "Show me certificates expiring in the next 30 days."
  • "Run an RBL check on mail.example.com and tell me which sources flagged it."
  • "What alerts went out this week, and to which contacts?"

The AI translates requests into tool calls against your account, returns results conversationally, and chains follow-up queries without leaving your AI tool.

How to Connect

The MCP endpoint is at https://api.generatorlabs.com/4.0/mcp. Authentication supports both HTTP Basic (API key) and OAuth 2.1 with PKCE.

Claude Desktop (API key):

{
  "mcpServers": {
    "generator-labs": {
      "type": "http",
      "url": "https://api.generatorlabs.com/4.0/mcp",
      "headers": {
        "Authorization": "Basic <base64 of AccountSID:AuthToken>"
      }
    }
  }
}

Claude.ai / ChatGPT (OAuth): add a custom connector with the endpoint URL. The OAuth flow opens in your browser to approve scopes.

Supported Tools

Area Tools Scope
RBL monitoring List/inspect hosts, listings, profiles, history, manual checks mcp:read, mcp:write
Certificate monitoring List/inspect monitors, expiring certs, errors, compliance audits mcp:read
Notifications Contacts, groups, webhooks, recent alerts mcp:read
Account Summary, balance, server health mcp:read

Three preset prompts are also available for multi-step workflows: certificate renewal audit, incident triage, and monthly compliance review.

AI monitoring overview | MCP Documentation | Configuration Guide

New Blacklist Data Sources

We've expanded the global blacklist data source library with over 30 new entries across IPv4, IPv6, domain, and DNS firewall categories.

If your Monitoring Profile has "Stay in-sync with us" enabled, these sources will be picked up automatically on your next check cycle. If you manage your source list manually, you'll need to enable them yourself under RBL Monitoring > Monitoring Profiles > Data Sources. Either way, if there are any sources you don't want, you can disable them individually on the profile and they won't affect other profiles or other accounts.

IPv4 Blocklists

  • JustSpam DNSBL: community-driven blocklist targeting confirmed spam sources
  • DroneBL: open proxy, botnet, and compromised host detection used widely by IRC and mail operators
  • DAN.ME.UK TOR Exit List: active Tor exit nodes; complements the existing DAN.ME.UK TOR list
  • Mailspike Z: confirmed spam wave participants, with a single block-level return code
  • Mailspike Reputation: IP reputation scoring; flags low-reputation senders
  • Junkemailfilter.com (HostKarma): community-maintained IP reputation list
  • TornevallNET DNSBL: open proxy and abuse detection
  • ThreatInt DNSBL: threat intelligence feed covering spam and malicious infrastructure
  • MailCleaner IP RBL: spam sender IP list maintained by the MailCleaner project
  • Virusfree BAD / BIP: high spam rate senders and botnet IP addresses from the Virusfree project
  • ScientificSpam BL: targets academic spam operations (journals, conferences, publishers)
  • abuse.ro RBL: Romanian abuse tracking list covering spam and malicious hosts
  • Suomispam BL: Finnish spam IP blocklist
  • Brukalai DNSBL: Lithuanian DNSBL covering spam and abuse
  • PCCC WILD RBL: honeypot and spam sample-based blocklist
  • DrMX BL: spam trap and ISP feedback-based blocklist
  • fmb.la BL: community spam tracking list
  • Polspam BL / H1 / H2 / H3: Polish blacklist covering spam sources at four aggression levels (standard and three progressively stricter tiers)

URIBL / Domain Blocklists

  • URIBL Multi: combined zone covering URIBL's black, grey, and red domain lists
  • SpamEatingMonkey URIRED: high-confidence spam domain list (red tier)
  • Rspamd URIBL: domain blocklist maintained by the Rspamd project
  • MailCleaner SPAM URI BL: URI blocklist maintained by the MailCleaner project
  • ScientificSpam RHSBL: domain-level counterpart to the ScientificSpam IP list
  • abuse.ro URIBL: domain-level abuse tracking
  • Suomispam Domain BL: Finnish spam domain blocklist
  • Polspam RHSBL / H / V / Danger: Polish RHSBL at four aggression levels

IPv6 Blocklists

  • Polspam IPv6 BL: IPv6 counterpart to the Polspam IPv4 blocklist

DNS Firewall

Three DNS firewall sources have been added that detect when a monitored host is resolving blocked domains via a protective DNS resolver:

  • CIRA Canadian Shield Protected: blocks malware and phishing domains
  • CIRA Canadian Shield Family: blocks malware, phishing, and adult content
  • OpenDNS Security: blocks malware, phishing, and botnet command-and-control domains

These sources are useful for monitoring hosts that act as DNS resolvers or that have DNS firewall policies enforced at the network level.

Email Deliverability Checks

New email deliverability checks are available for RBL Monitoring profiles. These checks verify the DNS and TLS configurations that receiving mail servers evaluate to score inbound mail, catching the misconfigurations that quietly cause mail to land in spam or get rejected.

Available Checks

IP-based checks (IPv4 and IPv6 hosts):

  • Reverse DNS (rDNS): the IP has a PTR record
  • Forward-Confirmed Reverse DNS (FCrDNS): the PTR resolves forward back to the original IP
  • Generic PTR Pattern: PTR doesn't look like a dynamic / consumer hostname
  • PTR Hostname Format: PTR has at least 2 labels and a valid alpha TLD

Domain-based checks (URIBL and URI hosts):

  • MX Health: MX records exist and at least one MX target resolves
  • SPF Record: domain publishes a valid SPF record
  • SPF Record (Strict): SPF record uses an enforcing policy (-all or ~all)
  • SPF Lookup Limit: SPF stays within RFC 7208's 10-lookup cap
  • DMARC Record: domain publishes a valid DMARC record
  • DMARC Record (Strict): DMARC record uses an enforcing policy (p=quarantine or p=reject)
  • TLS-RPT Record: domain publishes a TLS Reporting record
  • MTA-STS Policy: domain publishes a valid MTA-STS policy
  • BIMI Record: domain publishes a valid BIMI record

How to Enable

All deliverability checks are opt-in. Even with "Stay in-sync with us" enabled, none of these run unless you specifically enable them on a Monitoring Profile.

Go to RBL Monitoring > Monitoring Profiles > Data Sources, switch to the Email Deliverability tab, and check off the ones you want.

We recommend creating a dedicated "Email Servers" profile for your mail-sending hosts so that non-mail hosts don't generate noise alerts for checks that don't apply to them.

Failures trigger the same alerts and webhooks as blacklist listings, so they integrate into your existing notification pipeline.

Email Deliverability Documentation

Prometheus Exporter

A Prometheus exporter for Generator Labs is now available on GitHub. It exposes Blacklist Monitoring and Certificate Monitoring data as Prometheus metrics.

Installation

Three install options are available:

  • Pre-built binaries: Download from the GitHub releases page and run directly.
  • Docker: Pull ghcr.io/generator-labs/prometheus-exporter:latest and run with credentials passed as environment variables.
  • Build from source: Requires Go 1.21 or later.

Configuration

The exporter requires two credentials: Account SID and API Token. These can be supplied as flags (--account-sid, --auth-token) or environment variables (GENERATOR_LABS_ACCOUNT_SID, GENERATOR_LABS_AUTH_TOKEN).

The exporter listens on :9786 by default. Use --enable-rbl and --enable-cert to control which check types are active. The API request timeout defaults to 30 seconds and is configurable via --api-timeout.

Metrics

Metric Type Description
generatorlabs_rbl_listings Gauge Number of active RBL listings
generatorlabs_cert_errors Gauge Number of active certificate errors
generatorlabs_api_up Gauge 1 if the API call succeeded, 0 if it failed
generatorlabs_api_duration_seconds Gauge API call duration in seconds
generatorlabs_exporter_info Gauge Exporter version info

The generatorlabs_api_up and generatorlabs_api_duration_seconds metrics include a check label with values rbl or cert.

Prometheus Configuration

Add a scrape job targeting port 9786. A 5-minute scrape interval and 60-second timeout are recommended given the API polling frequency.

Example alerting rules are included in the repository, covering active RBL listings, certificate errors, API downtime, and elevated API error rates.

github.com/generator-labs/prometheus-exporter | Documentation

Updated Nagios and Zabbix Plugins

Updated Nagios and Zabbix plugins are now available on GitHub. Both replace the legacy RBLTracker plugins and add Certificate Monitoring support.

Nagios Plugin

The updated Nagios plugin is a bash script that calls the Generator Labs API and maps the response to standard Nagios exit codes: OK when no issues are detected, CRITICAL when issues are found, and UNKNOWN on error.

The plugin supports two check types:

  • rbl: checks Blacklist Monitoring for active blacklist listings
  • cert: checks Certificate Monitoring for active certificate errors

Install by copying check_generator.sh into your Nagios plugins directory and adding the command and service definitions to your configuration. A complete example configuration is included in the repository.

github.com/generator-labs/nagios-plugin | Documentation

Zabbix Plugin

The updated Zabbix plugin is a native Zabbix template using built-in HTTP Agent items. No external scripts or curl calls are required. Zabbix communicates with the Generator Labs API directly.

Install by importing generator_zabbix.yaml via Configuration > Templates > Import, linking the template to a host, and setting the {$GENERATOR_ACCOUNT_SID} and {$GENERATOR_API_TOKEN} macros. The API token macro is configured as a secret type so the value is masked in the Zabbix UI. The template includes items, triggers, and graphs for both RBL and Certificate Monitoring. Requires Zabbix 7.0 or later.

github.com/generator-labs/zabbix-plugin | Documentation

Migrating from the Legacy Plugins

The legacy RBLTracker plugins covered Blacklist Monitoring only. Replace them with the updated plugins to add Certificate Monitoring support.

API v4.0 and Updated SDKs

API v4.0 is now available. The updated API and all five official SDKs are live and ready to use.

New SDKs

Five official SDKs are available for API v4.0, replacing the legacy RBLTracker SDKs for PHP, Node.js, and Python. Go and Ruby are new additions.

Language Install Repository
PHP composer require generatorlabs/sdk github.com/generator-labs/php-sdk
Node.js npm install generatorlabs github.com/generator-labs/node-sdk
Python pip install generatorlabs github.com/generator-labs/python-sdk
Go go get github.com/generator-labs/go-sdk github.com/generator-labs/go-sdk
Ruby gem install generatorlabs github.com/generator-labs/ruby-sdk

What's New in v4.0

Certificate Monitoring API. All five SDKs include full support for the Certificate Monitoring API: listing certificate errors, managing certificate monitors, and managing certificate profiles. This was not available in the v3 API.

Expanded language support. Go and Ruby SDKs are new. The existing PHP, Node.js, and Python SDKs have been rebuilt under the Generator Labs package name with updated language requirements: PHP 8.1+, Node.js 18+, Python 3.8+.

TypeScript. The Node.js SDK is now written in TypeScript with full type definitions included.

Automatic pagination. All SDKs handle paginated responses automatically. Iterate through large result sets without manual page management.

Retry logic. Automatic retry with exponential backoff is built into all SDKs. The Retry-After header is respected when the API returns rate limit responses.

Webhook verification. All SDKs include a helper for verifying the HMAC signature on incoming webhook requests.

Migrating from v3

If you are using the legacy v3 packages, migrate to the new packages above. The v3 packages remain available but will not receive updates.

The v4.0 API uses the same Account SID and Auth Token credentials. The base URL and authentication scheme are unchanged. Refer to the API documentation for the full endpoint reference and the migration guide for step-by-step migration notes.

Certificate Monitoring Now Available

Certificate Monitoring is now generally available. You can add hosts, configure alert thresholds, and start receiving expiration alerts today.

What It Does

Certificate Monitoring checks your SSL/TLS certificates continuously and alerts you before they expire. Every check goes beyond the expiration date: full chain validation, hostname verification, revocation status, algorithm strength, and DNS CAA record configuration are all validated on each run.

There are 8 independently configurable alert types per monitoring profile:

  • Expiration: alerts at up to 10 configurable thresholds, anywhere from 0 to 90 days before expiration
  • Chain integrity failures: catches missing or expired intermediate certificates
  • Hostname mismatches: flags certificates that do not cover the host they are serving
  • CA trust failures: alerts when a certificate cannot be validated to a trusted root
  • Revocation: detects certificates pulled by their CA
  • Certificate fingerprint changes: tracks renewals and unexpected replacements
  • Certificate flapping: multiple fingerprint changes in a short window, often indicating a load balancer misconfiguration
  • Missing or misconfigured CAA records: ensures only authorized CAs can issue for your domains

Monitoring Profiles

Monitoring Profiles group hosts with shared settings. Create a Production profile with aggressive thresholds and PagerDuty alerts, a Staging profile with looser thresholds and email-only, and an Internal profile for private CA hosts. Profile changes apply immediately to all assigned hosts.

Internal Certificate Monitoring

External monitoring cannot reach internal services, private CA infrastructure, or self-signed certificates. Deploy a lightweight monitoring agent inside your network as a Docker container. The agent checks internal hosts and reports certificate data to the platform over outbound HTTPS. No inbound firewall rules are required. Private keys never leave your network.

The monitoring agent is open source and available on GitHub.

Every Protocol

Monitors direct TLS on any port, plus STARTTLS for SMTP, IMAP, POP3, LMTP, FTP, and LDAP. Implicit TLS variants (SMTPS, IMAPS, POP3S, FTPS, LDAPS) are also supported.

Pricing

Certificate Monitoring is priced at $0.01 per host per day. There are no contracts, no minimums, and no flat monthly fees. You pay only for active hosts.

Learn more about Certificate Monitoring or view pricing.

Portal Rebrand and Account Improvements

This release brings a re-branded portal experience, stronger account security options, better billing visibility, and more ways to receive alerts.

Portal Re-branded to Generator Labs

The customer portal has been updated to reflect the Generator Labs brand. You will see the new Generator Labs domain and logo when you log in. All existing bookmarks and links will continue to work through automatic redirects. Your account credentials and settings remain unchanged.

Enhanced Multi-Factor Authentication

MFA has been significantly expanded to give you more flexibility and stronger security:

  • Multiple MFA methods: you can now register more than one MFA option on your account, so you are never locked out if a single device is unavailable
  • Security key support: hardware security keys like YubiKey are now supported as an authentication factor
  • Backup codes: generate a set of one-time backup codes to store securely as a recovery option if your primary MFA method is inaccessible

Billing History

A new billing history section is now available in the portal. It shows your accumulated account charges broken down by month, giving you a clear view of your usage and spending over time.

New Contact Types

Three new contact types are available for alert delivery:

  • Google Chat: send alerts directly to a Google Chat space
  • OpsGenie: create OpsGenie alerts from monitoring events
  • Microsoft Teams: deliver alerts to a Microsoft Teams channel

RBLTracker is Now Generator Labs

Today marks an exciting milestone as RBLTracker becomes Generator Labs. This rebrand reflects our evolution and vision for the future as we expand beyond blocklist monitoring into a comprehensive infrastructure monitoring platform.

What This Means for You

If you're an existing customer, absolutely nothing changes on your end. Your account credentials work exactly as before, all your monitoring continues uninterrupted, and your pricing stays the same. We've handled everything behind the scenes to make this transition seamless.

The New Website

Along with the rebrand, we've launched a completely redesigned website. The new site features a modern interface that's fully responsive across all devices, improved navigation to help you find what you need faster, and better organized documentation and resources.

Why Generator Labs?

As we've grown, we've been working on expanding our monitoring capabilities beyond RBL monitoring. With certificate monitoring and TLS configuration analysis on the horizon, the RBLTracker name no longer captured where we're headed. Generator Labs better represents our mission to generate reliable monitoring solutions for businesses of all sizes, both now and in the future.

Learn More

Visit our transition guide for more details about the rebrand and what it means for your monitoring services.

Microsoft SNDS Support Added

We've added support for Microsoft Smart Network Data Services (SNDS), giving you deeper insights into how Microsoft views your email sending reputation.

Understanding SNDS

Microsoft SNDS provides valuable data about email sent from your IP addresses to Microsoft email services including Outlook.com, Hotmail.com, and MSN.com. This service helps you understand your reputation from Microsoft's perspective and catch potential deliverability issues before they impact your users.

What You Can Monitor

Our SNDS integration automatically retrieves your reputation data and tracks key metrics like spam complaint rates, spam trap hits, message volume, and overall IP reputation scores. You'll get real-time monitoring with historical trend analysis, so you can spot patterns and address issues proactively.

Getting Started

Check out our documentation for a detailed setup guide.

AWS CloudWatch and SNS Notifications

We've added native support for AWS CloudWatch and AWS SNS, making it easier than ever to integrate our monitoring with your existing AWS infrastructure.

CloudWatch Metrics

Our CloudWatch integration automatically publishes your monitoring metrics to your AWS account. This means you can view RBL listing events right alongside your other AWS metrics.

Visit our CloudWatch integration guide for step-by-step instructions.

SNS Notifications

With SNS support, you can publish alerts to any SNS topic and fan them out to multiple endpoints. This opens up powerful automation possibilities: forward alerts to Lambda functions for automated remediation, send notifications to multiple Slack channels or email lists, or archive everything to S3 for compliance.

Visit our SNS integration guide for step-by-step instructions.

Additional DNS Security Data Sources

We've expanded our DNS security monitoring by adding three new blocklist sources: DNS4EU, AdGuard, and Control-D.

Why More Sources Matter

Different DNS security providers use different filtering methodologies and data sources. By monitoring against multiple providers, you get broader threat coverage and can detect regional blocking issues that might only appear in certain resolver networks. This also helps reduce false positives: if your domain is blocked by one provider but not others, it's worth investigating whether it's a legitimate concern or an overly aggressive filter.

The New Sources

  • DNS4EU is the European Union's public DNS resolver with a focus on privacy and GDPR compliance. It provides malware and phishing protection while respecting user privacy.

  • AdGuard DNS specializes in ad and tracker blocking with family protection filters. If you're running any ad-supported services, monitoring against AdGuard helps ensure you're not inadvertently blocked.

  • Control-D brings modern DNS filtering with custom blocklist management and advanced filtering capabilities. Their geographic routing options mean they can provide regional blocking insights that other providers might miss.

Expanded Webhook Support

We've expanded our webhook capabilities with new event types covering billing, account management, and RBL monitoring.

Billing and Account Events

Our webhook system now supports seven billing-related events: account balance threshold alerts, auto-recharge success and failure notifications, billing package renewals, credit card expiration warnings, and plan expiration alerts. This makes it straightforward to integrate billing activities into your internal systems: notify your finance team when auto-recharge fails, or track renewals in your accounting software.

Blacklist Monitoring Events

We've added webhooks for host check lifecycle events. Subscribe to notifications when host checks are initiated and completed. Combined with existing listing and delisting events, you get complete visibility into your monitoring operations.

Testing

Validate webhook configurations by selecting a webhook, clicking "Send Test," and choosing an event type. You'll see the complete response including status codes, timing, TLS details, and headers.

Configuration

Set up webhooks through Dev → Webhooks in the portal. Each webhook needs a display name and a publicly accessible HTTP(s) endpoint URL. You can subscribe to multiple event types per webhook.

We're regularly adding new event types. Visit our webhook documentation for complete details on payload schemas and available events.

New Management Portal Release

We're excited to roll out our completely redesigned management portal with major improvements to performance, user experience, and functionality.

A Modern Interface

The new portal features a clean, intuitive design that works seamlessly across all your devices. We've added dark mode support for late-night monitoring sessions and improved accessibility throughout.

Better Host Management

Managing large numbers of hosts is significantly easier now. We've added bulk import and export capabilities, tag-based organization, and quick edit functionality that lets you update multiple hosts at once.

Automatic Migration

The new portal is now live at portal.generatorlabs.com. All existing accounts have been migrated automatically. Your credentials and all your data remain exactly the same. Just log in and start exploring the new features.

Visit our documentation to learn about everything that's new.